

Measuring AM modulation index with an FFT
One cursor measurement, one formula: read the carrier-to-sideband delta in dB from any FFT and convert it straight into AM modulation depth.
The modulation index m of an AM signal (0…1, or 0…100 %) states how far the carrier envelope swings. In the frequency domain there is an elegant shortcut: a clean AM signal shows the carrier plus two sidebands offset by the modulating frequency, and the difference in dB between carrier and sideband encodes the modulation depth exactly.
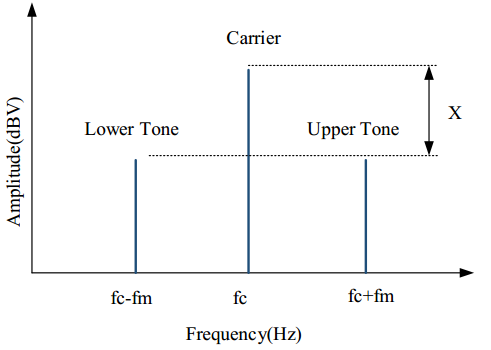
The formula
With ΔdB = (carrier level) − (one sideband level):
m = 2 x 10^(-ΔdB / 20)

Δ =  6 dB  →  m = 1.00  (100 %)
Δ = 12 dB  →  m = 0.50  (50 %)
Δ = 20 dB  →  m = 0.20  (20 %)
Δ = 26 dB  →  m = 0.10  (10 %)
Making the measurement
- On a spectrum analyzer: span a few times the modulating frequency around the carrier, RBW well below the offset, then use the delta-marker from carrier peak to either sideband
- On an oscilloscope: enable FFT math with a flat-top or Blackman window, zoom to the carrier region, and use cursors the same way
- Insert ΔdB into the formula — or keep the table above on the bench
Example: carrier −10.2 dBm, sideband −30.2 dBm → Δ = 20 dB → m = 0.20 (20 % AM)
Asymmetric sidebands or extra spectral lines mean distortion or incidental FM — the two-sideband formula assumes clean AM, so check both sidebands match before trusting the number.
This method needs no demodulator and works on any instrument with an FFT — from an entry SDS800X HD to an SSA analyzer — making it a fast production check for transmitters and generators.
Instruments used in this note
SSA3000X series from €1,159
Generate test AM signals with any SDG
Related application notes
Our engineers use these instruments daily — ask us anything.