

Bode plot of a filter with an oscilloscope and generator
Characterize a 30 MHz low-pass filter automatically: the scope drives the generator over USB, sweeps the band, and draws magnitude and phase in one pass.
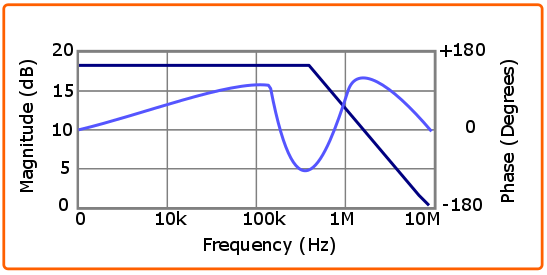
A Bode plot shows a device's magnitude and phase response over frequency on one shared axis — the quickest fingerprint of any filter. Doing it point-by-point with a generator and scope is tedious; the built-in Bode Plot function automates the whole sweep: the oscilloscope commands the generator over USB, steps the frequency, and plots both curves live.
Hardware
- Siglent 4-channel oscilloscope with the Bode function (X-E, X Plus, HD, 5000X/6000A series) — bandwidth comfortably above the highest frequency of interest
- Siglent SDG generator (any series), connected to the scope with a USB cable — or the SAG1021 module with a BNC tee
- 2 × 50 Ω BNC feed-through terminations (the DUT is a 50 Ω device; scope inputs are high-impedance)
- 3 × BNC cables and the DUT — here a 50 Ω, 30 MHz low-pass filter
Setup in four steps
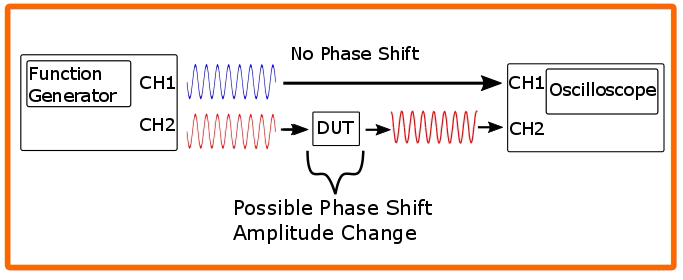
- Connect generator output through a tee: one leg to CH1 via a 50 Ω termination (reference), the other through the DUT to CH2 via the second termination
- Scope: Analysis → Bode Plot, select the connected SDG — the scope takes over generator control
- Configure the sweep: start/stop frequency (e.g. 100 kHz – 100 MHz), points, and output level (0 dBm is a good start)
- Press Run — magnitude and phase appear as the sweep progresses
Reading the result
For our 30 MHz LPF the magnitude is flat in the passband, −3 dB right at the 30 MHz corner, and rolls off steeply above — with the phase winding through the transition band. Cursors read exact values at any frequency; the trace exports as CSV.
Remember the scope's own datasheet bandwidth is its −3 dB point — for accurate filter corners, use a scope with real margin above your DUT's band, and keep the generator's maximum frequency in mind.
Instruments used in this note
Bode plot built in — from €899
SDG800/1000X/2000X/6000X all supported
Related application notes
Our engineers use these instruments daily — ask us anything.