

Measuring power-supply control-loop response with Bode Plot II
Phase margin and gain margin without a frequency-response analyzer: the scope's Bode Plot II function, a Siglent generator and an injection transformer measure loop stability directly.
Stability is the make-or-break characteristic of a regulated power supply — and traditionally it required a dedicated frequency-response analyzer. Siglent's Bode Plot II function builds that measurement into the oscilloscope: combined with a Siglent SDG generator (or SAG module) and an injection transformer, it sweeps the loop and plots gain and phase directly.
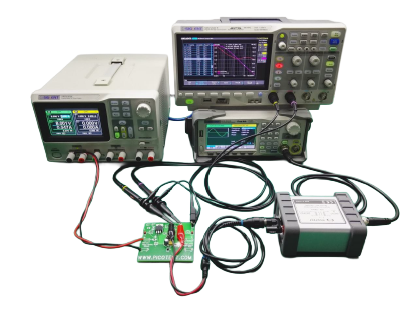
The principle in three sentences
A regulated supply is a feedback amplifier; its stability is judged from the loop gain. Plot loop gain versus frequency and read two numbers: phase margin (phase distance from the critical point where gain = 0 dB) and gain margin (gain distance below 0 dB where the phase hits the critical point). Healthy designs keep a phase margin of roughly 45° or more.
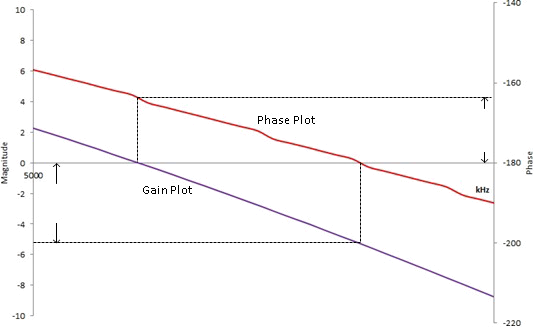
Injecting without breaking the loop
You can't literally break the loop — the DC operating point would run away. Instead, insert a small injection resistor (Picotest recommends 4.99 Ω for the J2100A transformer) between the output and the feedback divider, and drive a swept signal across it through an injection transformer for galvanic isolation. The scope measures the signal on both sides of the resistor; their ratio over frequency is the loop gain.
Because you measure an open-loop parameter inside a closed loop, the phase plot starts at 180° and falls — read the phase margin relative to 0°, not −180°.
Equipment used
- Siglent oscilloscope with Bode Plot II (SDS1000X-E, SDS2000X-E, SDS2000X Plus/HD, SDS5000X and newer)
- Siglent SDG-series generator (or SAG1021 module), USB- or LAN-connected to the scope
- Injection transformer (e.g. Picotest J2100A) + 4.99 Ω injection resistor
- Two passive probes at 1×, e.g. PP215
Running the sweep
- Wire the injection resistor into the feedback path; transformer across it; probes on both ends to CH1/CH2
- Bode Plot II menu: set the generator connection, sweep span (e.g. 100 Hz – 1 MHz) and points per decade
- Enable Vari-Level — it lowers the stimulus amplitude around the crossover region so the loop isn't overdriven where it is most sensitive
- Run; the scope plots gain and phase and reads out both margins automatically
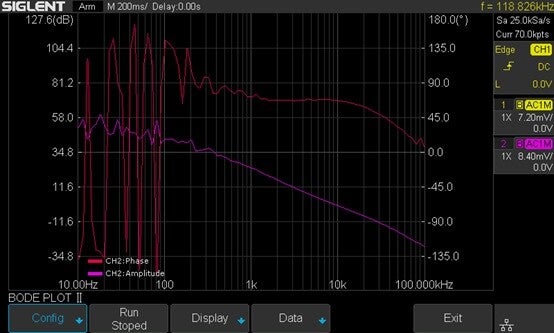
A result like 50° phase margin at a 20 kHz crossover tells you the supply is stable with sensible headroom — and the data can be exported as CSV for your design report.
Instruments used in this note
Bode Plot II built in — from €899
200 MHz probe used at 1× — €30
Any SDG series drives the sweep
Related application notes
Our engineers use these instruments daily — ask us anything.